Advantages of the map view
- Quick way to spot obstacles and react to them fast
- Intuitive presentation of progress
- Information is updated constantly based on the input from the field
Direct feedback from the field
GO FiberConnect has always focused on automated dispatching and receiving the work from the field. The situation on the map is also automatically updated by feedback from the field – no manual office work is needed. And it’s updated constantly!
What does the map show?
- Residence unit status
- Distribution point status
- Residence unit obstruction
- Distribution points obstruction
- Residence unit details
- Distribution point details
Realtime overview
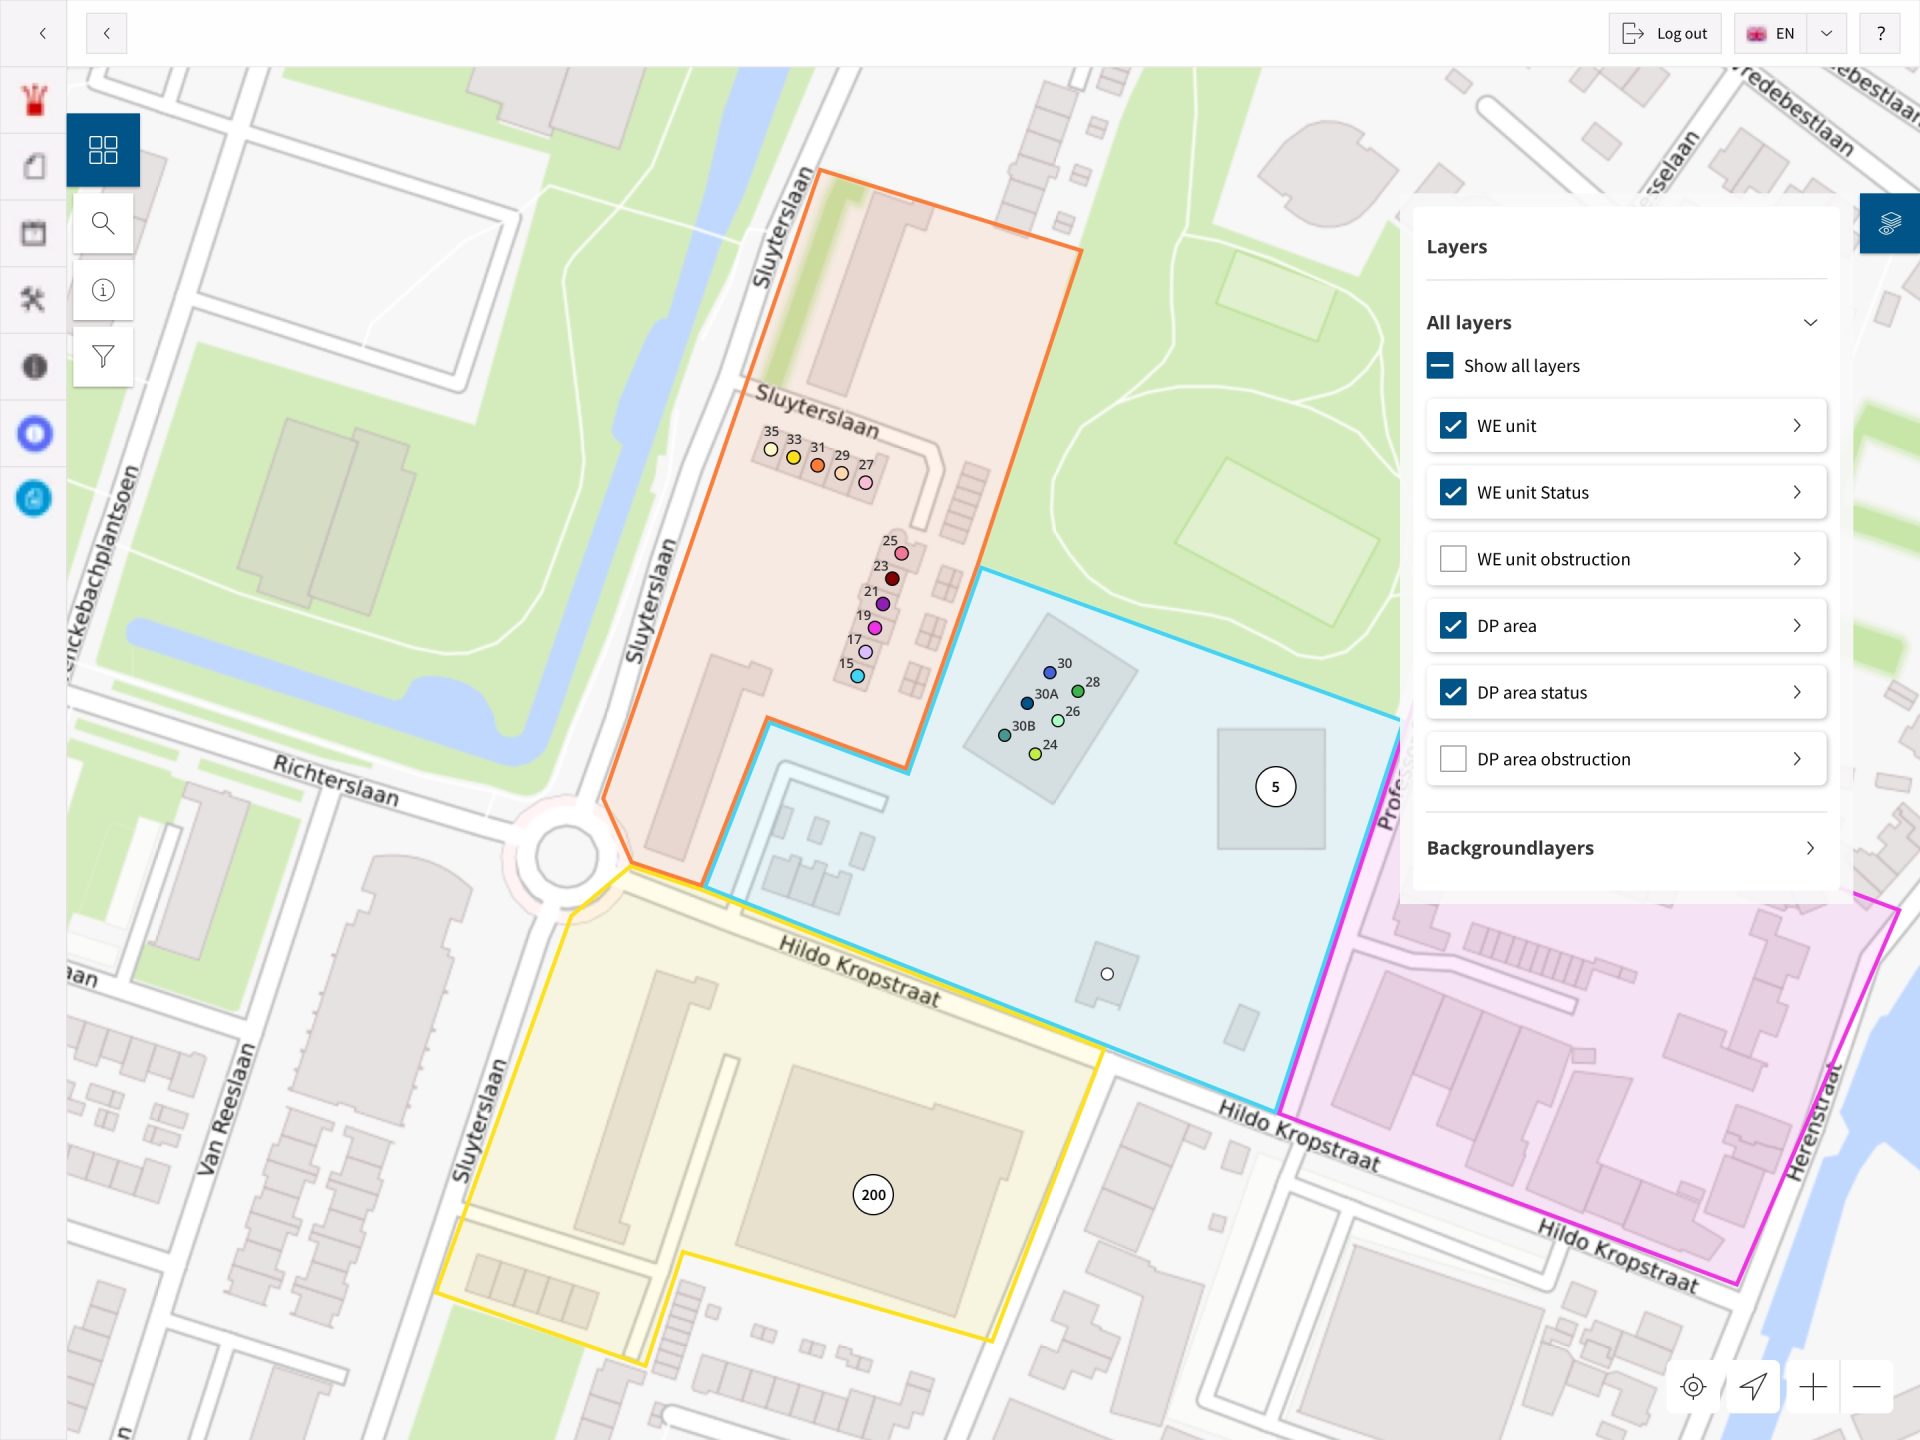
The map gives you an overview of your project. It is always up to date with the status of the work outside.
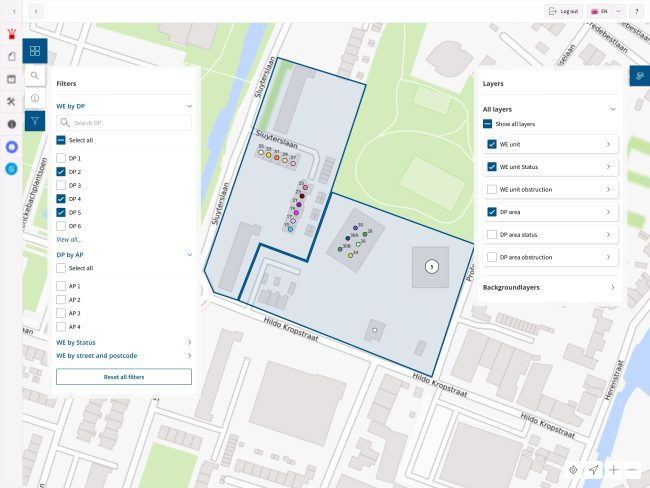
In this example, you see the Distribution Point areas (blue areas) containing the specific residence units (circles with house numbers).
Status by colour
The colour display shows you the status of your rollout project per Distribution Point area and residential unit. You can adjust the colours to suit your projects.
This helps you find out very easily for which Distribution Point areas the civil works have been completed. And use this as a reference point for the rest of the process, like the home inspection, garden drilling and blowing the fiber.

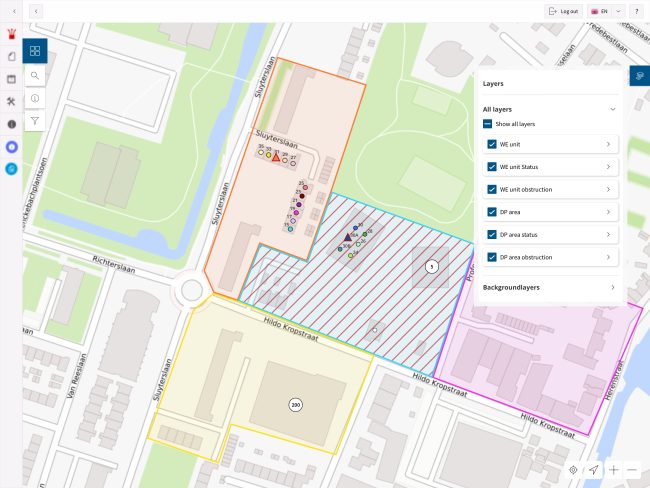
React to obstructions
Obstructions ask for your attention with a visual cue. In this example, the shaded red lines tell you that there is an obstruction in the blue Distribution Point area. And the triangle shapes call your attention to obstructions in two of the residence units.
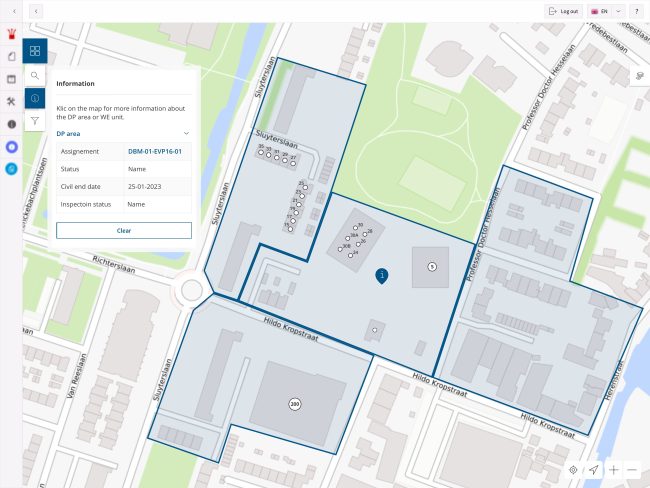
Get all the details
Want to know more details about the status? You can open a popup with more information by clicking on the map. This gives you all the details about the status of that individual housing unit or Distribution Point area.
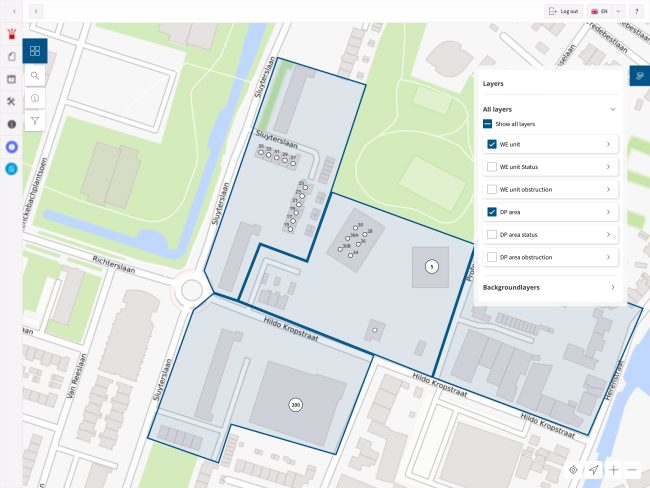
Filter for more focus
If you have larger projects, you can choose where you want to focus your attention by using the filters. Only the Distribution Point areas and the housing units that are selected in the filter are shown on the map.
Proven technology
The map in GO FiberConnect is based on the renowned GeodanMaps platform. GeodanMaps and GO FiberConnect are both in the portfolio of the Sogelink Group. The GeodanMaps platform is a basis for many mission-critical systems implemented for key organizations and administrations in the Netherlands.
![]()
Data driven
GO FiberConnect has always been driven by extensive data sets. The data sets detail on every aspect of the FTTH delivery process and are updated thousands of times every day. Now this data is shown in another dimension on the map.
Built for the future
For many this would be the end game, for us this is just a beginning. Thanks to GeodanMaps extensibility and in-house know-how we plan much more features. Think of detailed status per each feeder or distribution duct, geolocated photos and more.